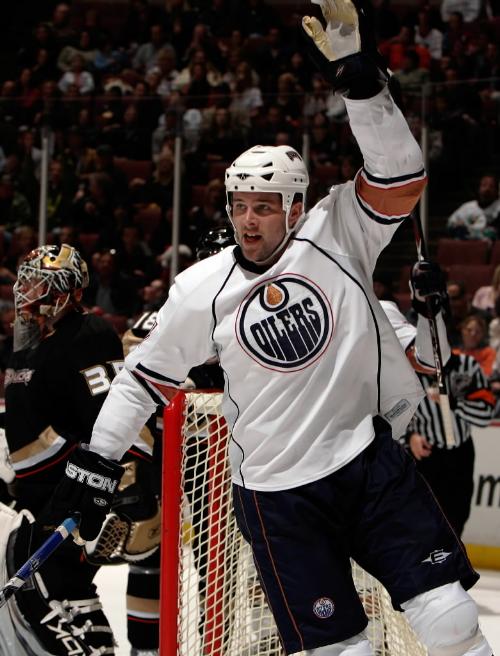
 The following is a guest post by Ric, who will be contributing more frequently about the Edmonton Oilers.
In some respects, the Oilers are in an envious position.
They are looking at another lottery pick and have chips to play at the deadline.
The most valuable chips: forwards Ales Hemsky and Dustin Penner.
Talent and toughness, for the right price.
Assessing the fit
As we have little to no access to the offers being floated, let us concern ourselves with: who should go, should both go, should we stand pat.
The resolution to such a concern starts at the NHL’s statistical database.
But before we begin our journey, a couple of words on the validity of their ability to assist with such a resolution.
Can statistics lie?
Real time stats are recorded by a myopic, dual – Bluetooth enabled – ear pieces wearing, curmudgeon with an HB2.
Although reality must be different; there are doubts nevertheless, because the statistics provided by the league are, in many respects, a fall woefully short of anything approaching comprehensive. A couple of quick examples: they don’t provide who was on the ice when a shot was taken, they don’t even hint at shot range.
All too often they misrepresent the activity by – and disrespect the accomplishments of – the players on the ice.
Sadly, it has come to where you start wondering, as you file into Rexall, “Should I grab any curmudgeon I see, destroy his glasses and dual – Bluetooth enabled – ear pieces, on the off chance that he is the guy responsible?”.
Real numbers; real issues
A classic, and painful, example is the discrepancy between venues in the giveaways/takeaways record.
The official statistics from nhl.com report that thus far this year:
| Home Giveaways | Road Giveaways | Differential* | |
| EDM | 556 | 194 | 2.87 |
| CBJ | 86 | 172 | 0.50 |
| Home Takeaways | Road Takeaways | Differential* | |
| EDM | 296 | 148 | 2.00 |
| ANA | 105 | 198 | 0.53 |
*Home/Road
Does the NHL really expect us to believe that the Oilers give up the puck three times more frequently at home?
Turnovers are the crucible in which the ability to possess the puck, control the flow and create or maintain momentum are put to trial, and the results of the test often determine whether games are won or lost.
But despite their status as a key determinate of success, the NHL seems rather blasé – flippant and/or uncaring at best, criminally negligent at worst – when it comes to recording them for posterity.
So, with such obvious and egregious flaws, how can giveaways/takeaways – or more broadly any NHL stat – assist in the resolution of the question at hand or advance our understanding of the value of potential trades and the embedded tradees?
In a vacuum, it can’t.
The lesson? That statistical analysis and interpretations maybe no more insightful than our subjective and biased eyes.
But aren’t pay grades based on “The Numbers”?
Paying for productivity
Image this contract conversation:
Owner: Okay, how much do you want?
Player: $100,000.00 (all money C$)
Owner: Sounds good, I will pay you that if you give me what I want.
Player: Please tell me the rumours aren’t true.
Owner: I want a 20/20/20/20/20 season.
(goals/assists/shots/hits/blocks – which begs the question: if he hits them all, does he become a five tool guy?)
Player: Should be doable, I did (redacted) last season and I am only (redacted).
Owner: Good. This should work then?
Owner takes a pull from his cigar and slides a piece of paper across the desk which reads:
| Goals | Assists | Shots | Hits | Blocks | |
| Expectation | 20 | 20 | 20 | 20 | 20 |
| Event’s Value | $1,000 | $1,000 | $1,000 | $1,000 | $1,000 |
| Total | $20,000 | $20,000 | $20,000 | $20,000 | $20,000 |
| Contract Value at Expectations | $100,000 | ||||
This hypothetical scenario has been provided to offer some context for the tables to follow.
Caveats
In the following breakdown, time on ice is used as the benchmark against which per 60 (an effort at understanding relative productivity by representing events on a per minute basis) as well as calculating hourly wage (salary divided by prorated, total time played).
Finally, goals, assists, shots, blocked shots and hits are given equal weighting and $/stat X represents one-fifth of total cap hit as a result.
| Playing Time | Games Played | Average Time on Ice | Cap Hit |
| Dustin Penner | 55 | 18:35 | $4,500,000 |
| Ales Hemsky | 39 | 18:26 | $4,100,000 |
| Jordan Eberle | 43 | 17:56 | $1,530,000 |
| Milan Hejduk | 50 | 17:38 | $3,000,000 |
| Kristian Huselius | 33 | 16:25 | $4,750,000 |
| Dany Heatley | 58 | 19:57 | $7,500,000 |
| David Backes | 55 | 20:01 | $2,500,000 |
| Ryan Malone | 50 | 16:14 | $4,500,000 |
Backes stands out as exceptional value, but none of the group is hurting their team to the point where a simulated kidnapping is in order.
| Games played | 07/08 | 08/09 | 09/10 | 10/11 | Prorated* |
| Dustin Penner | 82 | 78 | 82 | 55 | 80.54 |
| Ales Hemsky | 74 | 72 | 22 | 39 | 57.11 |
| Jordan Eberle | N/A | N/A | N/A | 43 | 62.96 |
| Milan Hejduk | 77 | 82 | 56 | 50 | 73.21 |
| Kristian Huselius | 81 | 74 | 74 | 33 | 48.32 |
| Dany Heatley | 71 | 82 | 82 | 58 | 84.93 |
| David Backes | N/A | 82 | 79 | 55 | 80.54 |
| Ryan Malone | N/A | N/A | 69 | 50 | 73.21 |
*used to determine the $ per stats.
| Raw Productivity | Goals | per 60 | $/Goal |
| Dustin Penner | 20 | 1.17 | $45,818.18 |
| Ales Hemsky | 9 | 0.75 | $130,826.21 |
| Jordan Eberle | 11 | 0.86 | $36,228.33 |
| Milan Hejduk | 17 | 1.16 | $39,529.41 |
| Kristian Huselius | 12 | 1.33 | $134,343.43 |
| Dany Heatley | 19 | 0.99 | $76,225.05 |
| David Backes | 20 | 1.09 | $25,454.55 |
| Ryan Malone | 11 | 0.81 | $91,636.36 |
| Raw Productivity | Assists | per 60 | $/Assist |
| Dustin Penner | 16 | 0.94 | $57,272.73 |
| Ales Hemsky | 24 | 2.00 | $49,059.83 |
| Jordan Eberle | 18 | 1.40 | $22,139.53 |
| Milan Hejduk | 28 | 1.91 | $24,000.00 |
| Kristian Huselius | 8 | 0.89 | $201,515.15 |
| Dany Heatley | 28 | 1.45 | $51,724.14 |
| David Backes | 21 | 1.15 | $24,242.42 |
| Ryan Malone | 23 | 1.70 | $43,826.09 |
This looks about right, unless you are Scott Howson.
Both Penner and Hemmer show well, except perhaps for Hemsky’s scoring numbers, but that is mitigated somewhat by his assist line.
| Shooting Efficiency | Shots | per 60 | Shots per Goal | $/Shot |
| Dustin Penner | 124 | 7.27 | 6.20 | $7,390.03 |
| Ales Hemsky | 78 | 6.49 | 8.67 | $15,095.33 |
| Jordan Eberle | 92 | 7.15 | 8.36 | $4,331.65 |
| Milan Hejduk | 120 | 8.18 | 7.06 | $5,600.00 |
| Kristian Huselius | 80 | 8.87 | 6.67 | $20,151.52 |
| Dany Heatley | 160 | 8.30 | 8.42 | $9,051.72 |
| David Backes | 148 | 8.07 | 7.40 | $3,439.80 |
| Ryan Malone | 140 | 10.34 | 12.73 | $7,200.00 |
Here Penner shows surprising accuracy, Backes again demonstrates good value, and Malone needs to shoot more than most due to the Lord equipping him with a shotgun rather than something with a scope.
| The Body | Hits | per 60 | $/Hit |
| Dustin Penner | 54 | 3.17 | $16,969.70 |
| Ales Hemsky | 28 | 2.33 | $42,051.28 |
| Jordan Eberle | 14 | 1.09 | $28,465.12 |
| Milan Hejduk | 6 | 0.41 | $112,000.00 |
| Kristian Huselius | 1 | 0.11 | $1,612,121.21 |
| Dany Heatley | 60 | 3.11 | $24,137.93 |
| David Backes | 147 | 8.02 | $3,463.20 |
| Ryan Malone | 106 | 7.83 | $9,509.43 |
Per minute is fun and occasionally insightful; per dollar is hilarious and occasionally embarrassing.
| The Body | Blocks | per 60 | $/Block |
| Dustin Penner | 24 | 1.41 | $38,181.82 |
| Ales Hemsky | 14 | 1.16 | $84,102.56 |
| Jordan Eberle | 11 | 0.86 | $36,228.33 |
| Milan Hejduk | 26 | 1.77 | $25,846.15 |
| Kristian Huselius | 3 | 0.33 | $537,373.74 |
| Dany Heatley | 23 | 1.19 | $62,968.52 |
| David Backes | 25 | 1.36 | $20,363.64 |
| Ryan Malone | 19 | 1.40 | $53,052.63 |
Looks like Penner wants to play for this team.
Conclusion teasers
What do these numbers tell us? Not much we didn’t already know.
But the question of Penner/Hemmer status needs to go beyond the numbers for it has a distinctly second bananian scent to it.
They are Barney, not Fred, Robin, not Batman, Martin, not Lewis.
But isn’t that okay? Doesn’t every team need a couple of Barney’s?
If we trade one or both, will we find ourselves wondering two years from now: If only we had a strong, threatening second line centreman?
The substitution effect
We have holes, but the front six, perhaps the front nine, does not number among them.
But by spending a chip, would we fill a hole only to dig another?
Getting out of the basement
If Hall and Eberle are who we think they are, we are going to need some straight men.
Men that can take on their second line and win.
Penner and Hemmer are just those kind of guys.
They are quality, perhaps not elite, but appropriately priced, on a team that has cap room.
And they work well into the future of this team.
Conclusion
Keepers.


